Not everything is observable. The most dangerous failures aren’t the ones that take you down — they’re the ones that never fully do.
There’s a comfortable illusion in modern engineering: the belief that if you collect enough metrics, you’ll eventually understand exactly what your system is doing. Just add more dashboards, more exporters, more telemetry, and the truth will reveal itself.
In practice, it doesn’t work that way. Not everything is observable.
A large part of your infrastructure behaves, from your point of view, like a black box. This gets more obvious the more managed services you adopt — a managed RDS, a managed load balancer, multiple Availability Zones, or cloud infrastructure in general. The provider hands you plenty of metrics, but that’s not the same as visibility into what’s happening inside.
You don’t necessarily know if a route changed, if a network component is misbehaving, if one zone is quietly degrading, or if any other internal event is dragging down your performance. And that leaves you with an uncomfortable question:
How do you build a resilient system when you can’t see all the information?
The gray zone between “healthy” and “down”
Picture an application running across three Availability Zones. At some point, your P90 latency starts creeping up. Is that your application? Or the infrastructure underneath it?
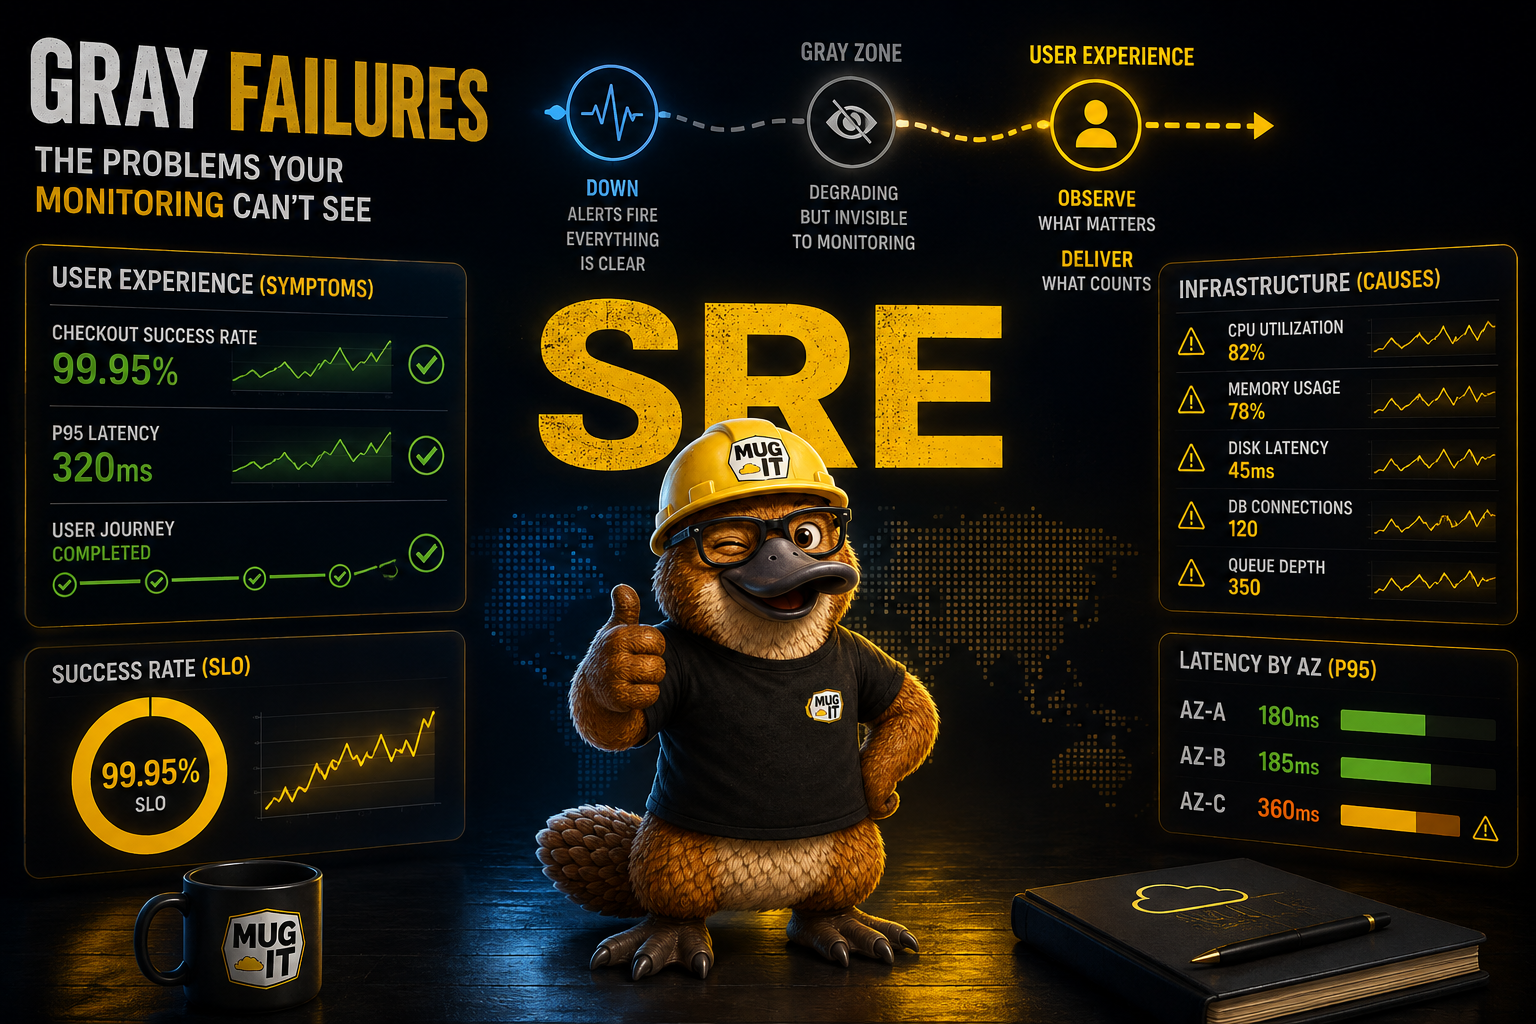
Maybe one of those three AZs is answering 20% slower than the other two. It’s not down. Health checks still pass. The provider is comfortably inside its SLA. But there’s a very real degradation, and your users are feeling it.
That’s a gray failure: a state that lives between completely healthy and completely unavailable. Something is wrong — but the traditional monitoring signals aren’t sharp enough to point at where.
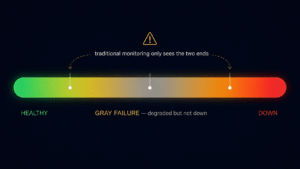
Binary monitoring only sees the two ends of this bar. Gray failures live in the middle — and that’s where most user pain hides.
This is the trap of binary health checks. HTTP 200 means “the server is answering,” not “the server is answering well.” A component can pass every liveness probe while delivering an experience nobody would accept. The health check and the user disagree, and the health check is the one you’re paging on.
Gray failures are dangerous precisely because they hide from the tools built to catch outages. Nothing is off. Everything is just… a little worse. And “a little worse,” multiplied across a critical path, is how you lose customers without ever triggering an alert.
The user journey is your source of truth
If you can’t see inside the black box, measure what comes out of it.
You will never fully instrument a managed database, someone else’s router, or a cloud zone’s internal networking. But you can always measure whether your users are succeeding. That’s why observability can’t be built by staring at infrastructure components alone — it has to include what the system actually delivers to the person on the other end.
It comes down to a much simpler question than any resource graph answers: how is the user experience right now?
So instrument the journey. Watch the flows that actually matter — login, search, cart, checkout, payment — and treat them as an external view of the system. Even when you can’t see inside a given black box, you can measure the result it produces. Assert the content, not the status code: did search return results, did the order get an ID, did the payment actually clear.
That’s the same idea as an SLI — a measurement taken from where the user stands. And it’s the one signal that keeps working no matter which layer the problem is hiding in.
Shrink the gray zone: segment everything
Here’s the part most teams skip. Gray failures thrive on aggregation. One global latency number averages the slow AZ together with the healthy ones until the problem disappears into the mean. The degradation is right there in your data — you just blended it into invisibility.
The fix is to segment aggressively so you can compare paths against each other:
- Running three AZs? Emit latency and error metrics per zone, not just globally.
- Multiple datacenters, clusters, or traffic paths? Compare their behavior side by side.
- Multiple regions or origins? Break the experience down by each one.
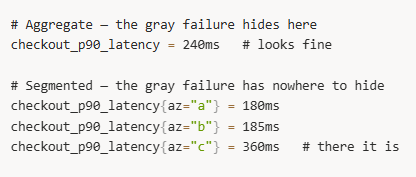
The more finely you segment your paths, the easier it becomes to say “this specific slice of the infrastructure is degrading” — even when the provider swears everything is fine. Comparison is your superpower here: you may not know why AZ-C is slow, but you can prove it is, because you have two healthy siblings sitting right next to it.
Detection isn’t enough — you need to react
Seeing the degradation is only half the job. A resilient system also has to do something about it.
If one AZ is consistently slower than the others, you don’t have to wait for it to go fully offline before acting. The provider being inside its SLA doesn’t obligate you to keep sending your users into a worse experience. You can shift traffic away from the degraded zone, drain it, or route to a path that’s currently delivering better results — and you can wire that decision to your own signals instead of waiting for a provider status page.
This is exactly where SRE thinking pays off:
- Reduce blast radius. A degraded path affects a slice of traffic, not all of it — if you can detect and isolate it.
- Automate the reaction. Load balancer weights, outlier detection, and traffic draining can respond to your comparative metrics faster than any human on call.
- Spend the error budget deliberately. A gray failure is a slow, quiet burn of your budget. Catching it early is the difference between a shrug and a postmortem.
The goal isn’t to eliminate uncertainty — you can’t. It’s to build mechanisms that let you perceive degradation through the system’s behavior, compare different paths, and react before the gray failure tips over into a full outage.
Accept that you’ll never see everything
At its core, gray failure is about accepting a hard truth: in a distributed system, you will never have complete visibility into every component. Managed services, cloud networking, third-party dependencies — large parts of your stack are permanently opaque to you.
That’s not a reason to give up on observability. It’s a reason to point it in the right direction. Stop expecting a green infrastructure dashboard to mean “healthy.” Start asking whether the user is getting what they came for, segment your paths so degradation can’t hide in an average, and give your system the ability to route around the parts that are quietly failing.
When we talk about observability and resilience, the user journey ends up being one of the most honest sources of truth about the real health of a system. The black boxes will keep their secrets. What they can’t hide is the experience they hand back to your users.
This week, take your most critical user journey and check one thing: are you measuring it per path — per AZ, per region, per cluster — or only as a single global number? If it’s global, you have a gray failure blind spot right now. Reply and tell me what you find — I read every one.
Want to go deeper on SLIs, SLOs, and building resilience into distributed systems? Check out the trainings at mugnos-it.com.
Cheers,
Douglas Mugnos
MUGNOS-IT 🚀