Following up on last week’s analysis of Evernote’s transition to a Site Reliability Engineering (SRE) model, today we address the most common bottleneck teams face when adopting these practices: the “blank page syndrome.”
It is easy to understand the theory behind Error Budgets, but translating a complex system architecture into precise, mathematically sound Service Level Indicators (SLIs) and Objectives (SLOs) is a time-consuming engineering challenge. This is where Artificial Intelligence, specifically Large Language Models (LLMs) orchestrated through programmatic pipelines, becomes a powerful operational tool.
The SRE Bottleneck
Defining SLIs/SLOs requires a deep understanding of the user’s critical journey and the underlying infrastructure. Engineers often spend weeks analyzing architecture diagrams, API specifications, and historical incident reports just to map out the Four Golden Signals (Latency, Traffic, Errors, and Saturation).
Instead of doing this manually, you can leverage AI to parse system documentation and output production-ready reliability metrics.
How to reduce Bottleneck
There are ways to make your own agent that can generate SLIs/SLOS for your architecture components, using tools like LangChain, you can create agents that can return more precise results.
However, what we need most of the time is not an agent that can do all the job, but an initial draft or starting point to fight the blank page syndrome.
A simple, yet effective way to help with SLI/SLO generation is by using prompt engineering, where you create a prompt full of context about your situation so you have a more precise answer.
Prompt engineering is any prompt that can be used on AI tools like ChatGPT, Gemini, Grok, etc.
But what is the context needed?
Since we are interacting with an LLM, it needs context to define the next token, however, if you don’t make details clear, thing like, components, code, and observability tools you are using, there’s a higher chance of getting AI hallucinations or unsatisfactory results.
Now, when we add context and details about your infrastructure, tying together with a desired output, like a SLI/SLO, the answer quality is vastly superior.
A Practical Example: Prompting for Reliability
Instead of asking a generic question like “What should my SLOs be?”, you must structure your prompt to enforce SRE constraints. Here is a prompt template idea you can use in your pipeline:
ROLE: You are a Senior Site Reliability Engineer with deep experience in observability and production systems.
GOAL: Define the Service Level Indicators (SLIs) and Service Level Objectives (SLOs) based strictly on the Four Golden Signals (Latency, Traffic, Errors, Saturation). For each SLI, specify the exact telemetry to collect, the measurement mechanism, and suggested thresholds for WARNING and ALERT.
CONTEXT: Analyze the following system architecture:
A simple event-driven application composed of three components:
- Producer Service – generates events and sends messages to a queue. (Language GO)
- Queue Service (AWS SQS) – buffers and stores messages until they are processed.
- Consumer Service – reads messages from the queue and processes them.(Language GO)
The producer publishes messages continuously to SQS.
The consumer polls the queue and processes each message.
Failures or delays in any component may affect message processing latency and system reliability.
CONSTRAINTS:
- Only use metrics that can realistically be collected from common telemetry sources (logs, metrics, traces, queue metrics, infrastructure metrics).
- Prefer percentiles for latency (e.g., p95, p99).
- Define thresholds that would indicate real user or system impact.
- Avoid generic or abstract indicators.
OUTPUT FORMAT: Create a table with the following columns:
Component | Golden Signal | SLI | Telemetry / Metric | Measurement Method | Warning Threshold | Alert Threshold | Why It Matters
By providing this structured prompt, the AI stops guessing and starts engineering. It forces the LLM to map your specific architecture to industry-standard metrics, calculating the exact error budget and alert thresholds required for your environment.
This is a template you should use, adding more information for better results. If you fail to do so, you will have a standard case of “Garbage In, Garbage Out”
Still, even in this example that have a low amount of information, there’s already an output that can be used as a direction to define what needs to be monitored(SLOs).
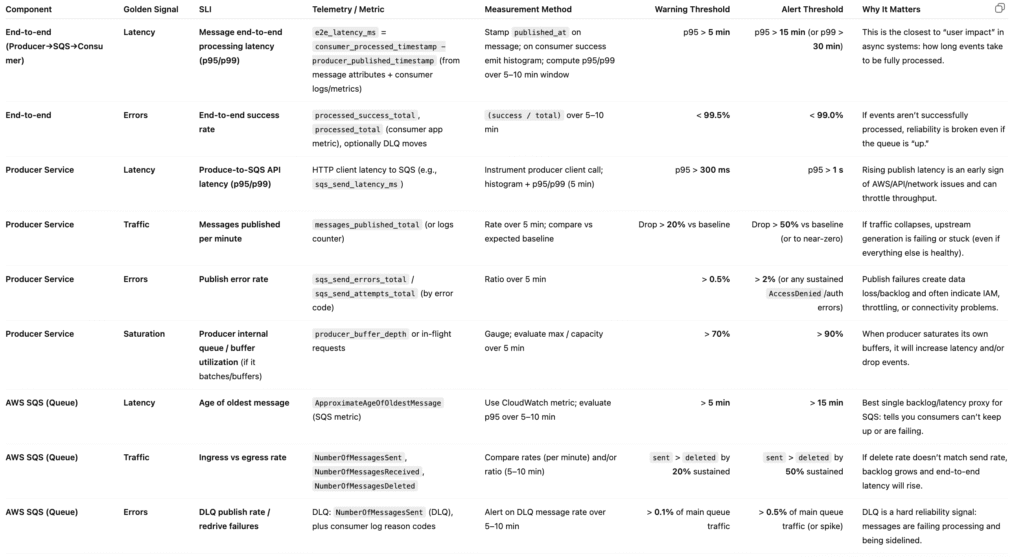
For this prompt, we used GPT-5-AUTO, it answered with a lot of relevant metrics, and, without a doubt, for the architecture provided in the prompt, it was pretty assertive.
The Outcomes
By orchestrating AI for this specific task, engineering teams achieve standardization across microservices. It eliminates subjective debates over what should be monitored and ensures that every new service deployed comes with a baseline set of SLIs and alerting thresholds derived strictly from industry-standard SRE mathematics. The outputted JSON can then be directly integrated into provisioning tools to automatically create Datadog or Prometheus dashboards.
If you’re enjoying this content, we’d love your feedback — and stay tuned, because there’s much more to come!
See you!!